Friction on Mesoscopic Scale


Stick-slip versus smooth sliding


Using the earthquakelike model, we describe the conditions when stick-slip appears, and consider transitions between the stick-slip and smooth sliding regimes for the multicontact frictional interface.


Introduction

The regime of motion of the frictional interface − either stick-slip or smooth sliding − is rather old but very important problem in tribology. In some situations (e.g., for violin playing) stick-slip is a desirable regime, but in a majority of cases (e.g., for windshield wiper, car engine operation, earthquakes, etc.) the stick-slip has to be avoided or suppressed at least. These two regimes, the stick-slip and smooth sliding, and the transitions between them are traditionally described by a phenomenological theory based on the "velocity weakening" assumption: if the friction force decreases when the sliding velocity grows, the motion may become unstable and could switch to stick-slip, either periodic or irregular (intermitted) motion. This theory predicts that generally stick-slip emerges for a soft system and low driving velocities. However, a general physical theory of this problem is still lacking. Here we develop such a theory for the multicontact interface (MCI), when the contact between two surfaces is due to many "frictional" contacts (asperities, bridges, etc.). The MCI is by the earthquakelike (EQ) model. The stick-slip motion in the MCI may appear, if and only if  two ingredients are incorporated into the model: the elastic instability of the system and aging of the contacts. This has been demonstrated briefly above; now we present a detailed theory.

We use the EQ model and assume that the distribution Pc(x) is Gaussian centered at x = xs= fs/k with a dispersion Δxs= Δfs/k. A typical dependence of the total force Fc from the contacts on the slider displacement X is shown in Fig.1. Except the exotic case of delta-function distribution of thresholds, the function Fc(X) always approaches the constant value Fk≈ 0.5 Nfs in the limit X; the value Fk corresponds to the kinetic friction force, while the maximum of the Fc(X) dependence is associated with the static friction force. We emphasize that the shape of the function Fc(X) depends not only on the dispersion of the distribution Pc(x), but also on the initial distribution Qi(f) of the system: the strongest initial oscillations of Fc(X) are achieved for the delta-function initial distribution Qi(f) = δ(f), while in the case of Qi(f) = Qs(f) (the stationary distribution) the force is independent of X,  Fc(X) = Fk.

Figure 1: Rigid motion of the slider: the total force from contacts Fc as function of the slider displacement X for two initial distributions Δf0/fs = 0.01 and 0.3 and two values of the threshold distribution Δfs/fs = 0.1 and 0.3 (see legend). Solid curves describe solutions of the ME, dotted curves show results of simulation of the EQ model with N = 103 contacts; the latter fluctuates with the amplitude ∝ N 1/2.


Elastic instability goto top

Now let us consider a system where the top block is driven with a velocity vd through a spring of elastic constant K so that the driving force is Fd= K (vdtX); the role of spring may be played by the elasticity of the slider itself, if the driving force is applied to its top surface. For adiabatically slow driving, vd→ 0, if one starts from the relaxed state at t = 0, the increasing driving force Fd has to be compensated by the force Fc from the interface contacts, so that they grow together at the beginning. However, when the slider displacement X approaches the threshold value xs= fs/k, the contacts start to break (see the point marked by "1" in Fig.2), the growth of Fc becomes slower and then changes to decreasing as shown in Fig.2. If the driving spring (or the slider) is stiff enough, K > K*, the driving force Fd will adjust itself to the changed value of Fc. For a soft system, however, at some point X* (marked by "2" in Fig.2) the two forces cannot compensate one another, an elastic instability occurs, and the slider will undergo an accelerated motion until the forces will compensate one another again.

Figure 2: Elastic instability.


An alternative explanation of the elastic instability follows from the consideration of the effective potential energy of the system. The total force applied to the bottom of the sliding block, which determines its displacement X, is the sum of the applied force and the friction force, Ftot(X) = K (vdtX) − Fc(X). It can be viewed as derived from the effective potential, Ftot(X) = −dVeff(X)/dX, where
 
Veff(X) = 1

2
K (vdtX)2 +
X

0 
 Fc(ξ) .
(8)
The slider state at the position X is stable if
d2Veff(X) /dX2 = K + dFc(X)/dX  > 0
and unstable otherwise. If we introduce the effective stiffness
Keff(X) = − dFc(X)/dX ,
then the slider motion becomes unstable for displacements X where Keff(X) > K. Thus, the critical stiffness is defined by
K* = max Keff(X) .
If K > K*, the system is stiff and does not undergo elastic instability.

Figure 3: The critical stiffness K* as function of the threshold dispersion Δfs for different values of the initial state distribution Δf0.


The critical value K* depends on two factors: on the threshold distribution Pc(f) and on the initial distribution Qi(f) = Q(f; X=0); the maximum value of K* is achieved for the delta-function initial distribution Qi(f) = δ(f), while the minimal value − equal to zero − for the stationary distribution Qi(f) = Qs(f). For the Gaussian shape of the initial and threshold distributions, the dependence of K* on the model parameters is shown in Fig.3; roughly it may be described by the formula
K*N k fs /(Δfs + Δf0) .

Dynamics goto top

However, the elastic instability is the necessary but not sufficient condition for stick-slip to appear; the second necessary condition is the aging of contacts − an increase of contact thresholds with their timelife. Indeed, if after breaking the newborn contacts obtain thresholds from the same distribution Pc(f), then the dependence Fc(X) will be the same too, and the scenario will not change despite the fact that the slider motion is accelerated for X where Keff (X) > K* as demonstrated in Fig.4.

Figure 4: Dependence of the spring force Fd= K (vdtX) (solid) and the slider velocity dX/dt (dotted curves, right axes) on the slider displacement X for two values of the spring constant: K/N = 5 (above the critical value K*/N = 3.59) and K/N = 2 (when the elastic instability occurs).


Parameters:  fs= 1, Δfs= 0.1, Δf0= 0.01, k = 1, vd= 1, M/N = 104 (so that Ω = (K/M)1/2= 223.6 for K/N = 5 and Ω = 141.4 for K/N = 2), η=200 ~ Ω, τd= 0, N = 104.


The simplest way to incorporate contact aging is to introduce a delay time τd, i.e., to assume that after breaking the contact reappears after some time τd (thus, for a contact with timelife shorter than τd the effective threshold is zero). Within the ME approach, the delay effects may be included as follows. Let N be the total number of contacts, Nc be the number of coupled (pinned) contacts, Nf = N Nc be the number of detached (sliding) contacts, and v = dX/dt  be the sliding velocity. The fraction of contacts that detach per unit displacement of the sliding block is  Γ(v) = ∫dx P(x; X) Q(x; X),  i.e., when the slider shifts by ΔX, the number of detached contacts changes by NcΓΔX, so that Nf = ΓvτdNc. Using Nc+ Nf = N, we obtain Nc= N /(1 + Γvτd) and Nf = NΓvτd /(1 + Γvτd). Introducing  x = 1/Γ and vd= xd, we can write
Nc = N

1 + v/vd
 .
(9)
The pinned contacts produce the force Fc(X)  which follows from the solution of the master equation (with Nc instead of N). Then the slider motion is described by the equation
M d2X(t)/dt2 + Mη dX(t)/dt = K [vdtX(t)] − Fc(X(t)) ,
where M is the slider mass and the coefficient η describes the damping of energy (e.g., due to phonons emitted) inside the slider; the latter is responsible for decaying ringing oscillations at stick-slip and thus can be found experimentally.

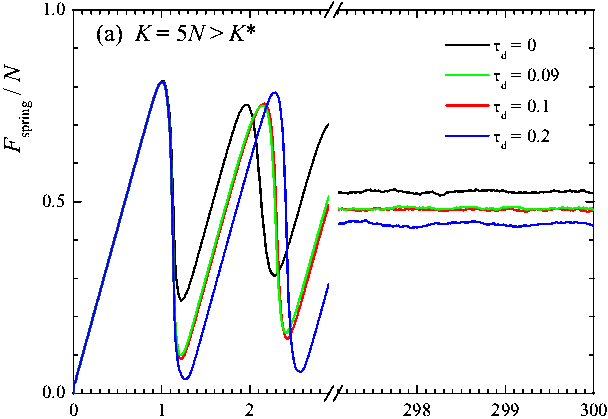
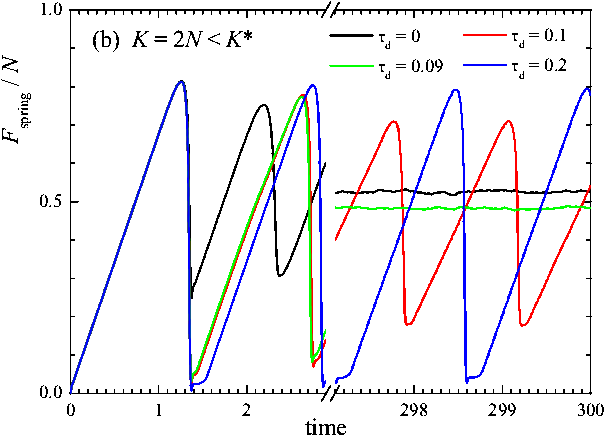
Figure 5: Dependence of the spring force Fd on time for different values of the delay time τd= 0, 0.09, 0.1 and 0.2 (see legend) for two values of the spring constant: (a) K/N = 5 and (b) K/N = 2. Other parameters as in Fig.4.

Figure 5 shows that for a large enough delay time τd > τ* the slider motion corresponds to stick-slip provided K < K*. Note also that for smooth sliding the kinetic friction decreases when τd increases, Fk ∝ (1 + v/vd)1, because of decreasing of the number of contacts simultaneously attached.

Figure 6: System dynamics at/after the elastic instability for K/N = 2 and τd= (other parameters as in Fig.4).


To find the critical delay time τ*, let us consider the slider trajectory just after the critical displacement X* (the point "2" in Fig.3), where the elastic instability occurs and the motion becomes unstable. The system dynamics is shown in Fig.6. Before the instability, t < t*, the two forces, the driving force Fd and the force from contacts Fc, approximately compensate one another, and the slider moves with a constant velocity, dX/dtvd. After t*, however, the forces become unbalanced, the difference ΔF = FdFc grows with Δt = t t* (see Fig.6a), and the slider undergoes an accelerated motion with increasing velocity (Fig.6c). For t > t* the slider position changes as
ΔX(t) ≈ vd Δt [1 + (1/6)(Ω Δt)2] ,
(10)
where Ω2= K/M. When the delay time is nonzero, the slider slips a distance ΔXd= ΔXd) during τd. Therefore, if ΔXd > 0.5Δxs, where Δxs= Δfs/k, most of the contacts will break and reform with f ~ 0 during the time τd, and the distribution of stresses shrinks, Q(f; t*+ τd) → δ(f) (more accurately, Q(f; t*+ τd) would have a dispersion Δfi~ kΔxi with Δxi~ vdτd ?). Thus, the next cycle begins with a narrow stress distribution, and the elastic instability will occur again as in the first cycle, so that we have stick-slip.

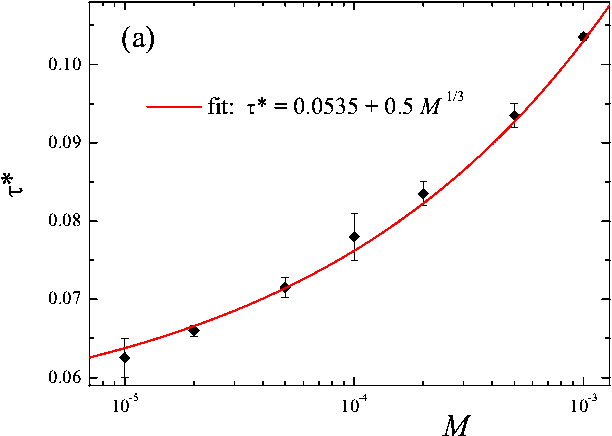
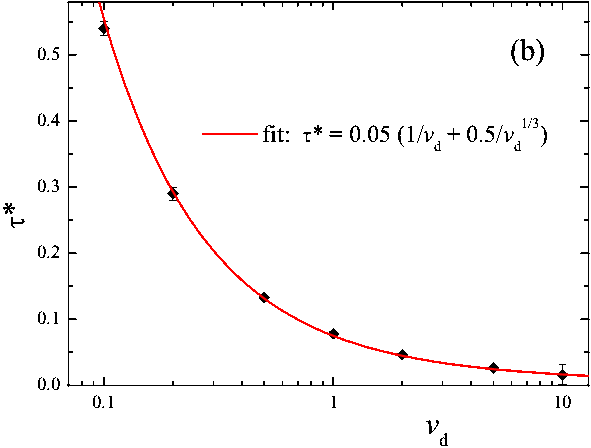
Figure 7: (a) The critical delay time τ* as function of the slider mass M at constant vd=1, and (b) τ* as function of the driving velocity vd at fixed M = 104.   K/N = 2 and η = 0.3Ω; other parameters as in Fig.4.

The critical delay time τ* may be estimated from Eq.(10); for Ωτ*<< 1 this gives τ*≈ Δfs/kvd, while for Ωτ*>> 1 it leads to a relation τ*≈ (6ΔfsM / kKvd)1/3. These relations agree well with the numerics (see Fig.7) which suggests the dependences τ*(M) ≈ A1+ A2M 1/3 and τ*(vd) ≈ A3vd1 + A4vd1/3, where A1...4 are numerical constants. Numerics shows also that τ* increases with the damping coefficient η. Of course, τ* also depends on the elastic instability criterion, i.e., on the parameters Δfs and Δf0.

Figure 8: The friction force as function of time, when the driving velocity vd (thick red line, right axes) continuously increases/decreases with time for fixed value of the delay time τd= 0.1.


Insets show the smooth to stick-slip transition at v1~ 1.8 when vd increases (left), and the stick-slip to smooth sliding transition at v1'~ 0.55 when vd decreases (right).


K/N = 2, M = 104 and η = 0.3Ω; other parameters as in Fig.4.


As follows from Fig.7b, for a fixed nonzero value of the delay time τd the system should undergo a transition from smooth sliding to stick-slip when the driving velocity grows. Such transition is demonstrated in Fig.8. Note that the system exhibits hysteresis: when the driving velocity increases, the smooth to stick-slip transition occurs at some velocity v1, while when vd decreases, the stick-slip to smooth sliding transition occurs at a lower velocity v1'. The hysteresis takes place because, as mentioned above, the criterion of the elastic instability to occur, depends on the initial distribution for a given cycle of stick-slip, which is different in the vd increasing and decreasing processes. The hysteresis indicates that the "stick-slip ↔ smooth sliding" transition could be classified as the (dynamic) "1st-order" transition.
Thus, the mechanism described above leads, depending on the system initial state and model parameters, to either stick-slip or smooth sliding. These regimes are stable, both correspond to regular motion, in particular, the stick-slip motion is strictly periodic (however, if the parameter τd takes random values from some distribution, then one may expect an irregular stick-slip as well).


Aging goto top

The simplest "delay time" variant of aging predicts the transition from smooth sliding to stick-slip with the growth of the driving velocity, which indeed was observed experimentally. More traditional, however, is the opposite scenario, when smooth sliding is observed at low vd and changes to smooth sliding when the driving velocity increases. Such a scenario can be described if we include aging of the contacts. Indeed, the threshold value of the contact after its breaking/restoring should grow with the time of stationary contact due to its aging, e.g., because of plastic deformations at the level of contacts or a slow formation of chemical bonds.

Although we do not know the actual aging mechanism, one may assume that the evolution of newborn thresholds can be represented as a stochastic process described by the simplest stochastic equation  dfsi = K(fsidt + G dw  with <dw> = 0 and <dw dw> = dt, where K(f) and G are the so-called drift and stochastic forces correspondingly. Alternatively, this process is described by the Langevin equation
dfsi(t)/dt = K(fsi) + (t)  ,
(11)
where ξ(t) is the Gaussian random force, <ξ(t)> = 0 and <ξ(tξ(t')> = δ(tt'). The Langevin equation (11) is equivalent to the Fokker-Planck equation (FPE) for the distribution of thresholds Pc(fsi; t):
  Pc

 t
+ dK

dfsi
Pc + K Pc

fsi
 =  1

2
G2 2Pc

fsi2
 .
(12)
Let us assume that the drift force is given by the expression
K(f) = β2( fsf ) ,
(13)
while the amplitude of the stochastic force is equal to
G = β δ fs √2 ,
(14)
where δ = Δfs/fs  and  β defines the rate of aging described by the timescale τβ= β2. With this choice, the stationary solution Pc0(f) of the FPE corresponds to the Gaussian distribution Pc0(f) = (2π)1/2fs)1exp[−(1/2)(1 − f /fs)22].
The ME approach should now be modified, because the distribution Pc(x) is not fixed but evolve due to ageing of the contacts. Equation (12) describes how the distribution of the thresholds evolves under the effect of aging alone. This equation may be rewritten as
  Pc

 t
= β2
 L
Pc ,      
L
=

φ
(φ 1+ δ2

φ
) ,
(15)
where φ f /fs. However, because the contacts continuously break and form again when the slider moves, this introduces two extra contributions in the equation determining ∂Pc/∂t in addition to the pure aging effect described by Eq.(15): a term  P(x; XQ(x; X)  takes into account the contacts that break, while their reappearance with the threshold distribution Pci(x)  (e.g., Pci(x) = δ(x)) gives rise to the second extra term in the equation. Therefore, the full evolution of Pc(x; X) is described by the equation
Pc(x; X)/∂X − (β2/v)LPc(x; X) + P(x; X) Q(x; X) = Pci(x) Γ(X) .
(16)
In the result we come to the set of equations that should be solved simultaneously.

Figure 9: Rigid motion of the slider. The total force from contacts Fc as function of the slider displacement X for different values of the aging rate β = 0, 1, 3 and 10 (see legend); dotted curve corresponds to motion without aging (Fig.1).


fs= 1, Δfs= 0.1, Δf0= 0.01, k = 1, and N = 2×10³.


The friction force as a function of the slider displacement X for the rigid motion of the slider is shown in Fig.9. One can see that the effective stiffness K* does not change significantly with β, while the stationary state at X essentially depends on the aging rate β; the latter corresponds to smooth sliding and may be found analytically.

Figure 10: The friction force versus time for different values of the aging rate β (see legend); stick-slip exists for the rates within the interval 1 ≤ β ≤ 1.6.


K/N = 1, M = 104, vd= 1 and η = 0.1Ω; other parameters as in Fig.9.


If now one will drive the slider through an attached spring, then the motion may correspond to either stick-slip or smooth sliding depending on the rate β; the stick-slip regime appears for the rates within some interval β1ββ2, while for smaller or larger values of β the motion is smooth (see Fig.10).

Figure 11: The friction force as function of time, when the driving velocity vd (thick red line, right axes) continuously increases/decreases with time.


The insets show the smooth to stick-slip transition at v1 and the stick-slip to smooth sliding transition at v2 when vd increases.


β = 1.5, other parameters as in Fig.10.


Thus, when the driving velocity continuously grows, the system should undergo two transitions, the smooth to stick-slip transition at v1 and the stick-slip to smooth sliding transition at v2; if then vd decreases, one again observes two transitions at v2' and v1' (see Fig.11). The critical velocities v1 and v2 depend on the aging rate β as shown in Fig.12. The first transition at v1 may be explained in the same way as above: the stick-slip occurs when τd > τ* (provided the instability criterion is satisfied), where now τdβ 2. The second transition at v2 takes place when the elastic instability disappears (see Fig.13).

Figure 12: The critical velocities v1 and v2 as functions of the aging rate β. Solid curves show fits vβ2.


The parameters as in Fig.11.


Figure 13: The friction force (a) and the effective stiffness Keff as functions of the driving velocity vd for the aging rate β = 1.


The parameters are as in Fig.11.


Summary goto top

Thus, the stick-slip emerges because of two factors, both of which are the necessary conditions. First, it must be the elastic instability. Second, it must be aging of the interface − the growth of the static thresholds with the timelife of a stationary contact. The first factor is controlled by the dispersion Δfs of the distribution Pc(f) of static thresholds. Therefore, using the interface with a large value of Δfs/fs, one may avoid the elastic instability and thus stick-slip. Besides, the value K* also depends on the distribution of stretchings in the initial state − if one starts with the stationary distribution Qs(f), the system would stay in the smooth-sliding regime forever. Because of the second factor − the contact aging − the stick-slip exists only for an interval of sliding velocities v1 < vd < v2 (which is in agreement, at least on a qualitative level, with experimental results, as demonstrated in Fig.14); both critical velocities v1,2 depend on the aging rate β as v1,2β 2. Therefore, the stick-slip may also be avoided by an appropriate choice of the operating velocities.   

Figure 14: Experimental results: the friction force (red), load (blue) and driving velocity (black, right axes) versus time for the elastomer sample (polydimethylsiloxane, PDMS) with the roughness Ra= 26 μm sliding over glass surface.


(O.M. Braun, Alain Le Bot, Michel Peyrard, Julien Scheibert, and D.V. Stryzheus, unpublished)

Contrary to the phenomenological approach widely used in description of stick-slip behavior, our approach is based on the model with well-defined parameters which may be measured experimentally and even calculated from first principles. However, a weak point of our model is that we do not know the aging mechanism in detail. Although it is quite hard to study this slow dynamics experimentally as well as with simulation, the problem of interface aging is extremely important not only for tribology, but for other topics, e.g., for seismology.


Next: Elastic slider

goto main Back to main page or tribology page


Last updated on April 23, 2014 by O.Braun.  Copyright © by O.Braun.  Translated from LATEX by TTH