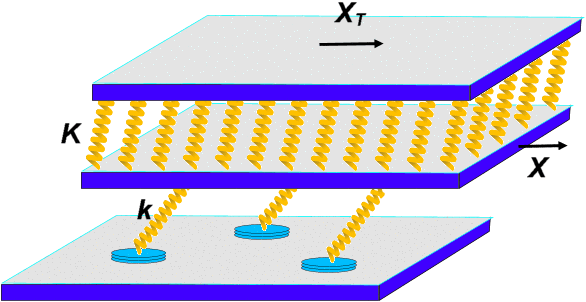
Earthquakelike model. The
EQ model describes the interface between the bottom of the solid block and the
fixed substrate.
 It
assumes that the interaction occurs through N asperities that
make contacts with the substrate. Each asperity is characterized
by its contact area Ai and an elastic
constant ki, schematized by an elastic
spring, which can be estimated as ki~ ρc2√Ai,
where ρ is the mass density and c is the transverse sound velocity of the material which forms the asperity. When
the bottom of the solid block is moved by X, the stretching xi of an asperity, i.e. its elastic deformation
with respect to its relaxed shape, increases. The force at the contact grows as
fi= kixi
until it reaches the threshold value fsi∝ Ai
at xsi= fsi /ki∝ √Ai;
at this point the contact rapidly slides, and fi and xi drop to a small value before a
contact is formed again.
It
assumes that the interaction occurs through N asperities that
make contacts with the substrate. Each asperity is characterized
by its contact area Ai and an elastic
constant ki, schematized by an elastic
spring, which can be estimated as ki~ ρc2√Ai,
where ρ is the mass density and c is the transverse sound velocity of the material which forms the asperity. When
the bottom of the solid block is moved by X, the stretching xi of an asperity, i.e. its elastic deformation
with respect to its relaxed shape, increases. The force at the contact grows as
fi= kixi
until it reaches the threshold value fsi∝ Ai
at xsi= fsi /ki∝ √Ai;
at this point the contact rapidly slides, and fi and xi drop to a small value before a
contact is formed again.
Let Pc(xs)
be the normalized probability distribution of values of the thresholds xsi at which contacts break. First we consider the
model in the quasi-static limit where inertia effects are neglected (this
restriction will be removed later, see
![]() ). The
distribution Pc(x) can be
characterized by its average value xs and
standard deviation σs; a
typical example is the Gaussian distribution Pc(x) = G(x;
xs,σs)
= [1/σ √(2π)] exp[−(x−xs)2/4σ2].
). The
distribution Pc(x) can be
characterized by its average value xs and
standard deviation σs; a
typical example is the Gaussian distribution Pc(x) = G(x;
xs,σs)
= [1/σ √(2π)] exp[−(x−xs)2/4σ2].
To describe the evolution of the model, we introduce the distribution Q(x; X) of the stretchings xi when the bottom of the sliding block is at a position X. Let all asperities be initially relaxed or weakly stressed, e.g., let the distribution Q(x; 0) = Qini(x) be Gaussian, Qini(x) = G(x; xini,σini) with xini= 0 and σini<< σs. Now, let us adiabatically increase the displacement X of the bottom of the top sliding block while the base (the bottom substrate) remains fixed. The sum of the elastic forces exerted on the bottom of the block by the stretched asperities makes up the friction force
|
(1) |
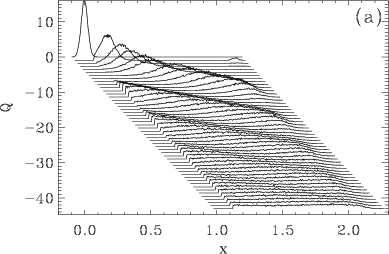
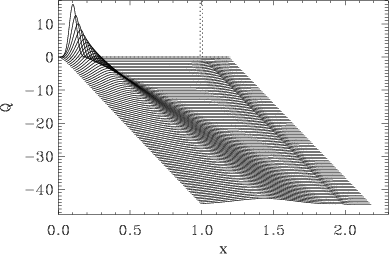
The evolution of the system, deduced from the numerical simulation of the EQ model, is presented in Fig.1. It shows that, in the long term, the initial distribution approaches a stationary distribution Qs(x) and the total force F becomes independent on X. The final distribution is independent of the initial one (an elegant mathematical proof of this statement was given in Z.Farkas, S.R.Dahmen, D.E.Wolf, J.Stat.Mech.: Theory and Experiment P06015 (2005); cond-mat/0502644; the authors considered a simplified version of the EQ model, assuming that every contact keeps its own threshold value fsi unchanged after breaking/reforming); the statement is valid for any distribution Pc(x) except for the singular case of Pc(x) = δ(x−xs).
|
|
|
|
|
|
|
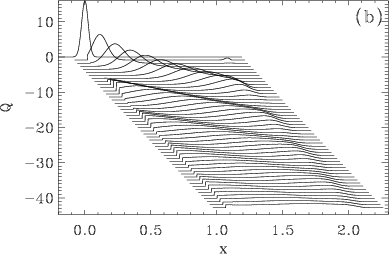
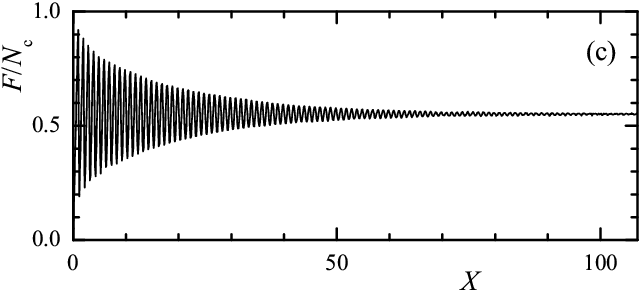
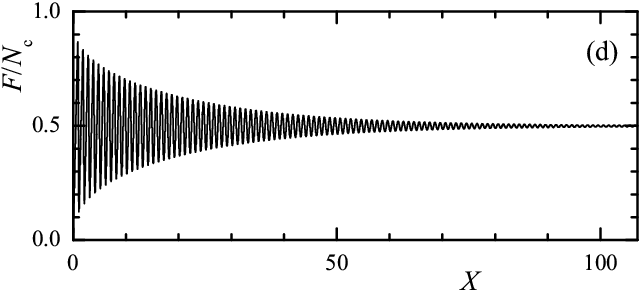
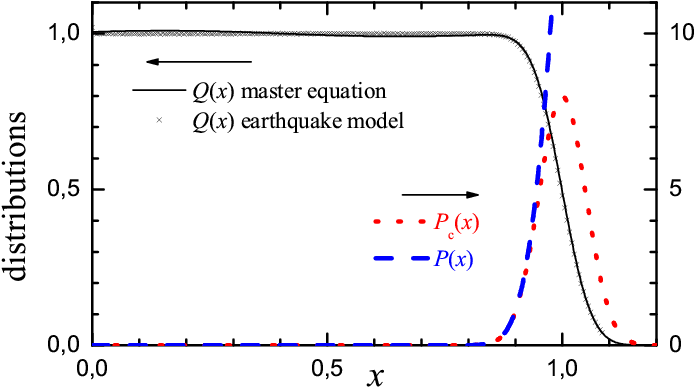
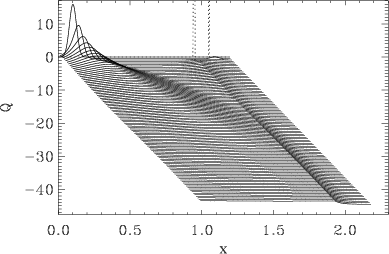
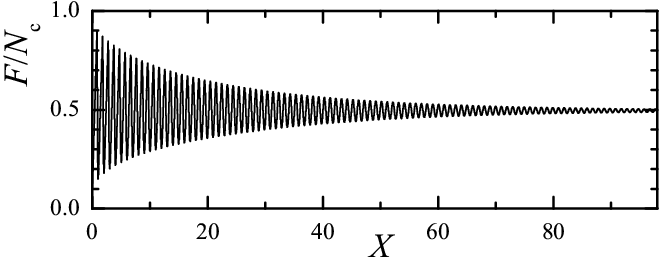
Figure 1: (a) Evolution of the EQ model. The curves show the distribution Q(x; X) versus x for incrementally increasing values of X with the step ΔX ≈ 1.05. The distribution Pc(x) is Gaussian with xs= 1 and σs= 0.05, the initial distribution Qini(x) is Gaussian with xini= 0 and σini= 0.025 so that F(0) = 0. (b) Solution of the master equation with the increment ΔX = 1.09 for the same model parameters. Panels (c) and (d) show the dependences F(X) for ‹ki› = 1 and K = ∞ for EQ and ME, correspondingly. |
|
Master equation. Rather than studying the evolution of the distribution Q(x; X) by simulation of the EQ model, it is possible to describe it analytically. Let us consider a small displacement ΔX > 0 of the bottom of the sliding block (for ΔX < 0 see below). It induces a variation of the stretching xi of the asperities which has the same value ΔX for all asperities. The displacement X leads to three kinds of changes in the distribution Q(x; X): first, there is a shift due to the global increase of the stretching of the asperities, second, some contacts break because the stretching exceeds the maximum that they can stand, and third, those broken contacts form again, at a lower stretching, after a slip at the scale of the asperities, which locally reduces the tension within the corresponding asperities. These three contributions can be written as a master equation for Q(x; X):
|
(2) |
|
(3) |
|
(4) |
|
(5) |
|
(6) |
Once the distribution Q(x; X) is known, we can calculate the friction force F(X) using Eq.(1). The static friction force corresponds to the maximum of F(X), i.e., Fs= F(Xs), where Xs is a solution of the equation F'(X) ≡ dF(X)/dX = 0. In order to simplify the further consideration, let us assume that Pc(x) = 0 for x ≤ 0 (this agrees with its physical meaning because, if x < 0, a positive variation ΔX actually reduces the absolute value of the force on a contact, which does not cause its breaking). Also we choose R(x) = δ(x), i.e., we assume that a broken contact sticks again only after a complete relaxation.
|
|
Figure 2: The final distribution Q(x) for the parameters from Fig.1 (solid curve; crosses show the averaged final distribution for the EQ model).
The red dotted curve shows the distribution Pc(x), and the blue broken curve shows P(x). |
The steady-state, or smooth-sliding solution, i.e. the solution of Eq.(6) which does not depend on X, can easily be found. It can be expressed as
|
(7) |
where Θ(x) is the Heaviside step
function, EP(x) = e
In the general case, let the distribution Pc(x) be of bell-like shape with the maximum at xs and the width σs. When X shifts for the distance xs, due to the breaking and reforming of contacts with a lower stretching, an initially peaked distribution Q(x; X) broadens by the value ~σs (Fig.1). Therefore, any initial distribution tends to the stationary one as |Q(x; X) − Qs(x)| ∝ exp(−X/X*), where X*~ xs2/σs.
|
(8) |
|
(9) |
|
(10) |
|
(11) |
In particular, if xs= 0,
then Qs(x) = Θ(x)pe
|
|
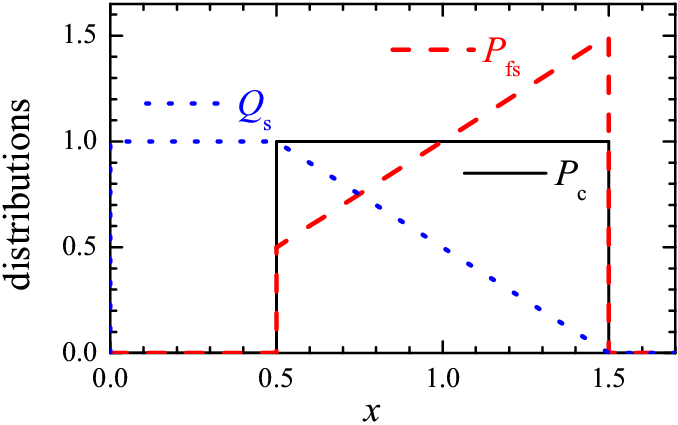
Figure 3: The stationary distribution Qs(x) (blue dotted line) and the corresponding distribution of static thresholds Pfs(x) (red broken line) for the rectangular distribution Pc(x) (solid line).
Remark: the probability distribution Pc(x), which determines the static thresholds {xsi} for newborn contacts, is different from the concrete realization of the distribution of static thresholds Pfs(x), i.e., the histogram calculated over the array {xsi}: while at the beginning Pfs(x) = Pc(x), then the function Pfs(x) evolves with time. |
Another simple example which admits the exact solution, is the case of rectangular Pc(x) distribution shown in Fig.3:
|
(12) |
|
(13) |
|
(14) |
and the "rate" P(x) is given by
|
(15) |
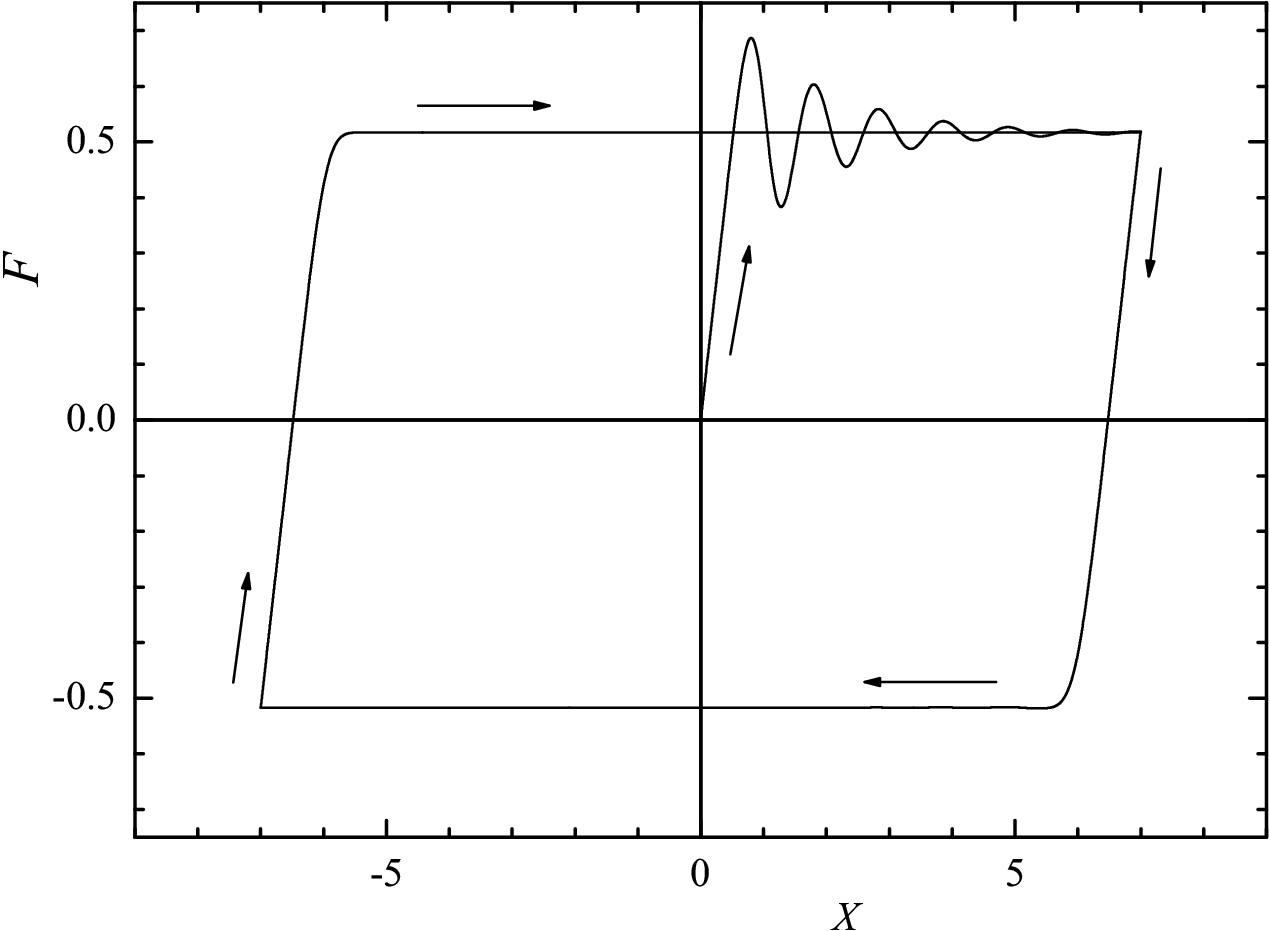
In a general case the solution of master equation always approaches the steady-state solution corresponded to smooth sliding. However, there is one exception from this general scenario, when the model admits a periodic solution and F(X) ≠ const even in the X → ∞ limit. Namely, this is the singular case when all contacts are identical, i.e., all contacts are characterized by the same static threshold xs, Pc(x) = δ(x−xs), or P(x) = 0 for x < xs and P(x) = ∞ for x ≥ xs. In this case we can find (guess) the steady-state solution of the master equation (e.g., it may be checked by direct substitution):
|
(16) |
|
|
(17) |
The static friction force takes the
minimal value Fs= 1/2Nkxs for the uniform initial distribution Qini(x) = xs
The periodic solution described above exists only for the distribution Pc(x) with the single threshold. If the contacts are characterized by more than one threshold value, for example, if one part of contacts has the threshold xs1 and another part, the threshold xs2 ≠ xs1 [i.e., Pc(x) is described by a sum of two delta-functions], then the system will always approach the stationary steady state. This is demonstrated in Fig.4, where we compare the system evolution in cases of one-peaked and two-peaked Pc(x) distributions. Notice, however, that this statement is valid only for the infinite set of contacts (the number of contacts with each threshold must be infinite) and cannot be applied for the system where, e.g., two tips move over a surface.
 |
 |
 |
 |
| Figure 4: Evolution of the model for two examples of
the Pc(x) distribution: Left coulomb is for one-peaked distribution of threshold, Pc(x) = G(x; x1, σ) with x1= 1 and σ = 10 |
|
Above we assumed that the slider moves continuously to the right, or ΔX > 0. In the case when the top substrate moves to the left, ΔX < 0, equations (3), (5) and (6) must be modified in the following manner:
|
(18) |
|
(19) |
|
(20) |
where for the symmetric case (the forward-backward symmetry) we have to put Pb(x) = P(−x) and Rb(x) = R(−x).
The reason for such a behavior is the irreversibility of the master equation. Equation (6) describes the "forward" dynamics when X increases, while Eq.(20) describes the "backward" dynamics when X decreases. Indeed, if the force fi on a given contact approaches and overcomes fsi, the contact breaks; but if we now reverse the motion direction, this contact cannot jump back to the value fi ≈ fsi; instead, fi will decrease until it reaches the value fi ≈ −fsi .
|
|
Figure 5: Friction loop. The distribution Pc(x) is Gaussian with xs= 1 and σs= 0.2, the initial distribution Qini(x) is Gaussian with xini= 0 and σini= 0.025. The top substrate moves to the right, then to the left, and finally again to the right as indicated by arrows |
In a typical tribological experiment, the top substrate moves periodically forward/backward, and in the result, the so-called "friction loop" is obtained. The same loop can easily be calculated with the ME approach as demonstrated in Fig.5.
Last updated on April 19, 2014 by O.Braun. Translated from LATEX by TTH